
Computer graphics and visualization have enabled the creation of increasingly realistic and immersive digital environments, as well as new ways to analyze and understand complex data.
Computer graphics and visualization are related fields that deal with the creation, manipulation, and display of visual content using computer technology. Both computer graphics and visualization rely heavily on mathematical and computational techniques to create and manipulate digital content. They also require a strong understanding of human perception and cognition to ensure that the visual content is effective in communicating information or engaging viewers.
Computer graphics is the field of computer science that deals with the creation, manipulation, and display of visual content using computer technology. It involves the use of software and hardware tools to create digital images, animations, and interactive media.
There are many applications of computer graphics, including video games, film and television, product design, architecture, and scientific visualization. Computer graphics techniques are used to create 2D and 3D graphics, as well as virtual reality and augmented reality environments. Computer graphics is a rapidly evolving field with a wide range of applications, and it will likely continue to grow and evolve as technology advances and new applications for digital visual content emerge.
Visualization is the process of representing data or information in a visual form, such as charts, graphs, diagrams, and maps, to facilitate understanding and analysis. The goal of visualization is to communicate complex data in a clear and concise manner, allowing viewers to easily identify patterns, trends, and insights.
Visualization focuses on the presentation and communication of data through graphical representations. This includes data visualization techniques such as charts, graphs, and maps, as well as scientific and medical visualization techniques used to analyze and understand complex data.
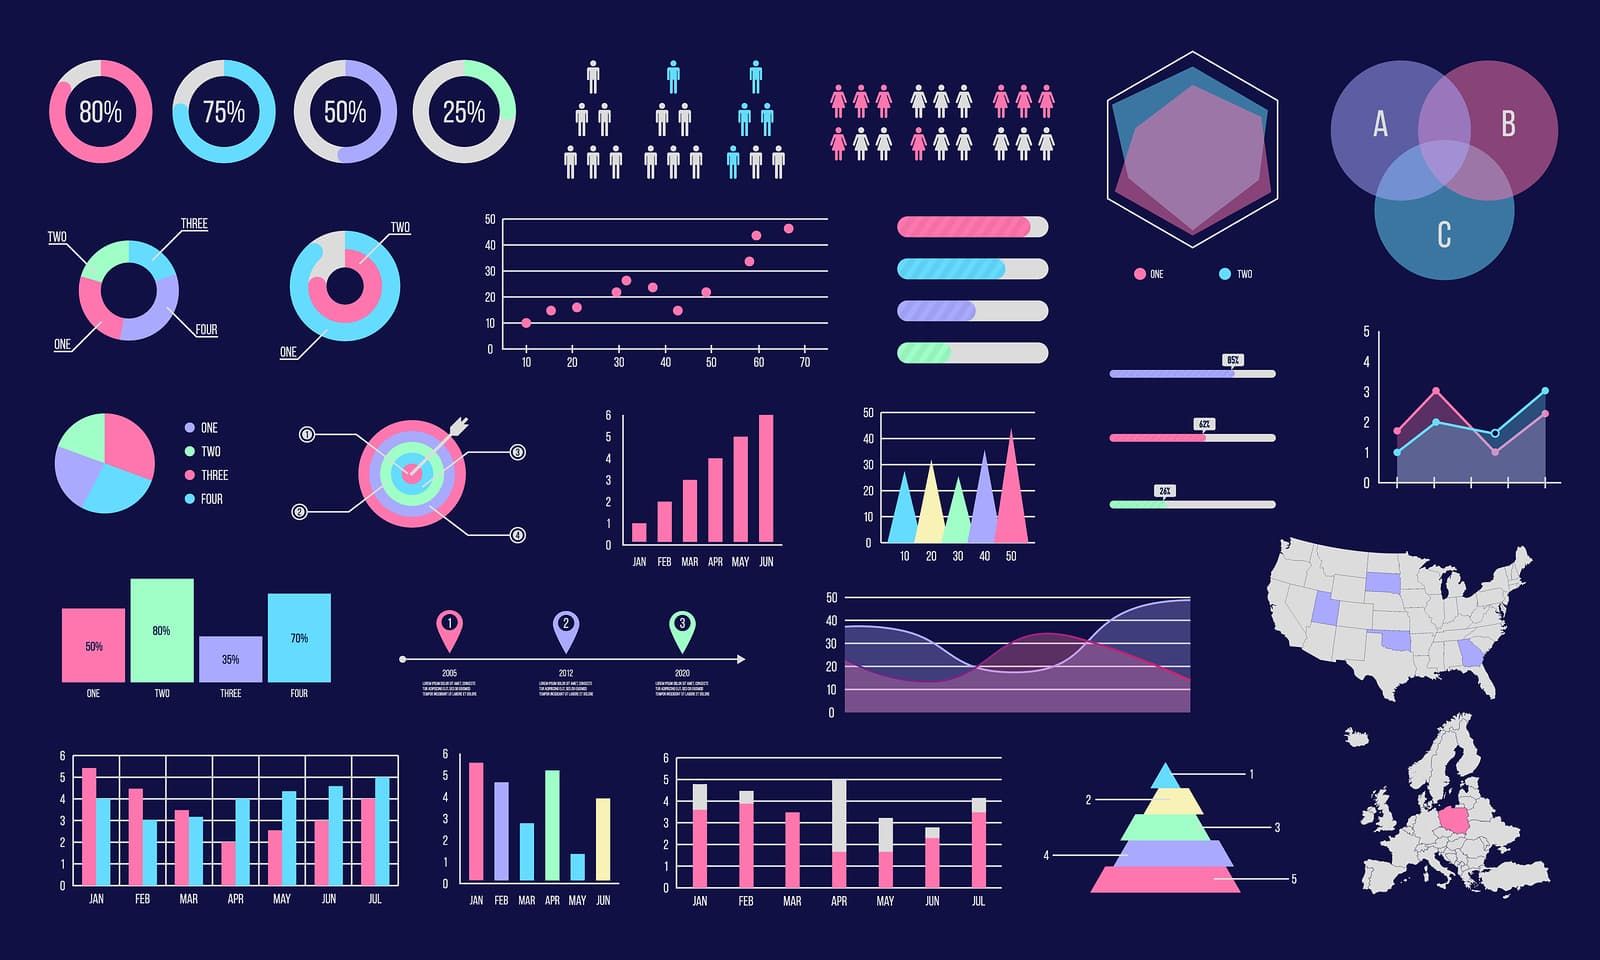
There are many types of visualization techniques, including:
- Charts and graphs: These are used to represent numerical data in a visual form, such as bar charts, line charts, and pie charts.
- Diagrams: These are used to represent relationships between different elements, such as flowcharts and organizational charts.
- Maps: These are used to represent geographic data, such as population density or weather patterns.
- Infographics: These are used to present information in a visual form, often combining multiple types of visualization techniques.
Good visualization should be visually appealing, easy to understand, and accurately represent the data being presented. It should also be tailored to the audience and purpose of the visualization, whether it is to inform, persuade, or entertain.
Visualization is a powerful tool for communicating complex data and insights, and it will likely continue to grow in importance as more data becomes available and the need for effective communication and analysis of that data increases.