
Jeralyn • April 8, 2023
Effective Dashboards
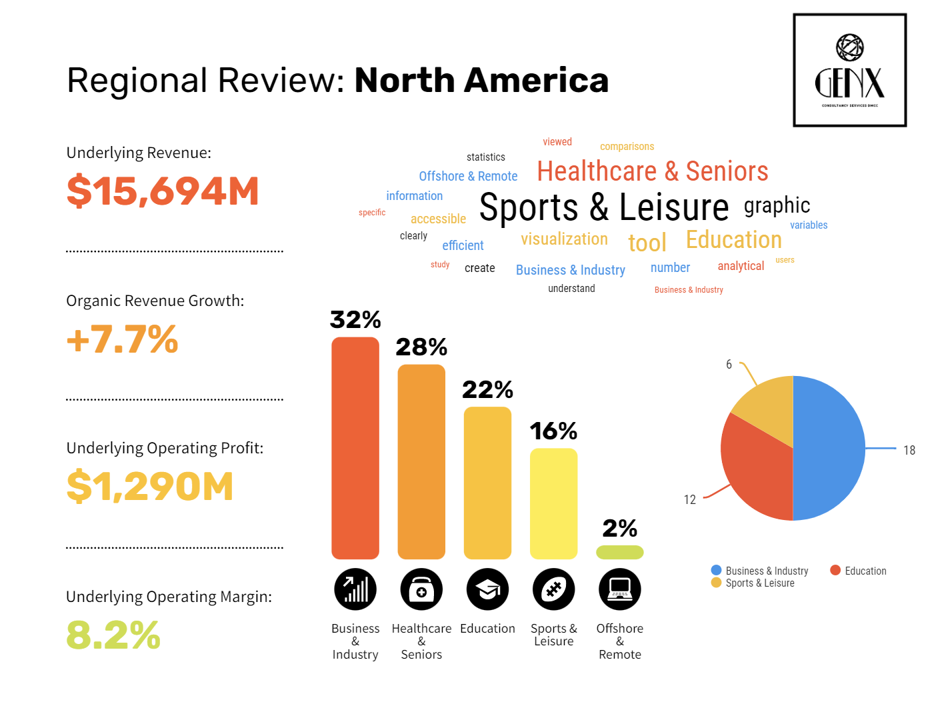
Empower users with insights and facilitate data-driven decision-making.
- Define clear objectives: Before creating a dashboard, it's important to define clear objectives and understand what insights or actions you want to derive from the data. This will help you design a dashboard that is focused and relevant to your specific needs.
- Choose the right data: Select data that is relevant and meaningful to your objectives. Avoid overwhelming the dashboard with too much data or irrelevant information, as it can confuse users and dilute the impact of the dashboard.
- Keep it simple: The design of the dashboard should be clean, simple, and easy to understand. Use clear and concise labels, avoid cluttered charts or graphs, and use visual elements that are easy to interpret. Less is often more when it comes to dashboard design.
- Use relevant visualizations: Choose the right type of visualization that best represents the data and insights you want to convey. Bar charts, line charts, pie charts, and gauges are some common types of visualizations used in dashboards. Select the visualization that best suits your data and the story you want to tell.
- Provide context: Contextualize the data by providing explanations, annotations, and interpretations. Use data labels, annotations, or tooltips to provide additional context and insights to users, helping them understand the data and its implications.
- Make it interactive: Interactive dashboards allow users to explore data and gain insights through filters, drill-downs, or other interactive elements. This can enhance user engagement and empower users to derive their own insights from the data.
- Ensure data accuracy: Ensure that the data displayed in the dashboard is accurate, up-to-date, and reliable. Any discrepancies or inaccuracies in the data can undermine the trustworthiness of the dashboard and compromise its effectiveness.
- Consider your audience: Tailor your dashboard to the needs and preferences of your audience. Consider their level of data literacy, their roles, and the decisions they need to make. A dashboard designed for executives may look different from a dashboard designed for analysts or operational teams.
- Regularly review and update: Dashboards are not static, and the data landscape can change over time. Regularly review and update your dashboards to ensure they remain relevant and effective in providing insights and driving decision-making.
- Test and iterate: Finally, test your dashboard with real users and collect feedback to identify any areas for improvement. Iterate and refine your dashboard based on feedback to continually enhance its effectiveness.