looka_production_114053565 • October 5, 2024
Statistics with Python
Common Statistical Operations with Python

Statistics with Python is the practice of using Python programming to perform statistical analysis. Python offers a variety of libraries and functions that make it easy to calculate and visualize statistics, conduct hypothesis tests, and analyze large datasets.
Key Libraries for Statistics in Python:
- NumPy: Fundamental library for numerical computing in Python. It provides support for large, multi-dimensional arrays and matrices along with mathematical functions to operate on them.
- Pandas: Essential for data manipulation and analysis. It provides data structures like Series (1D) and DataFrame (2D) for managing data efficiently.
- SciPy: Builds on NumPy to provide advanced mathematical functions and algorithms for optimization, integration, and statistics.
- Matplotlib and Seaborn: Visualization libraries for creating static, animated, and interactive plots. They help in understanding data distribution, relationships, and patterns.
- Statsmodels: Provides classes and functions for the estimation of many different statistical models, conducting statistical tests, and data exploration.
- Scikit-learn: Primarily for machine learning, but also includes tools for statistical modeling, regression, clustering, and more.
Common Statistical Operations with Python:
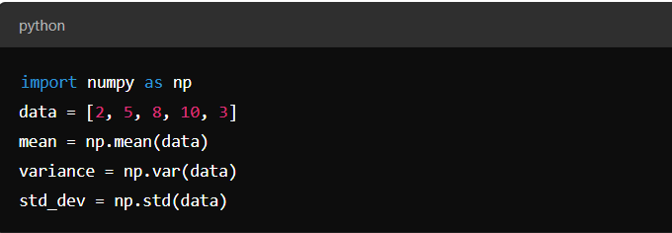
- Descriptive Statistics:
Mean, median, mode, variance, and standard deviation.
Example with NumPy:
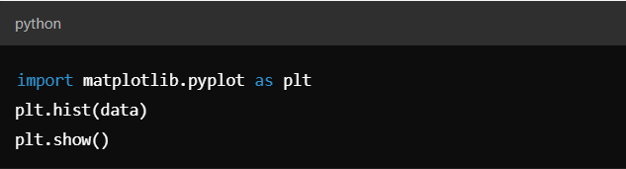
2. Data Visualization:
Using Matplotlib and Seaborn to create histograms, box plots, scatter plots, etc.
Example with Matplotlib:
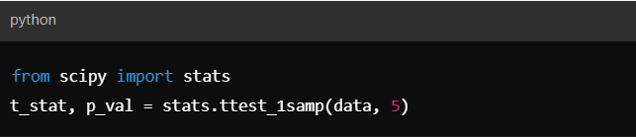
3. Hypothesis Testing:
Using SciPy to perform t-tests, chi-square tests, and more.
Example with SciPy
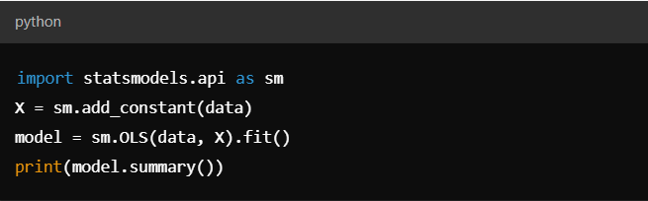
4. Linear Regression:
Using Statsmodels or Scikit-learn for regression analysis.
Example with Statsmodels